Sep 27, 2026Country Guides
South Africa Customs Data (2026): Two Layers for an Industrial Market
Statistics size the opportunity; declarations time it. How to sequence South Africa's two record types — and read imports for the gaps that local industry leaves open.
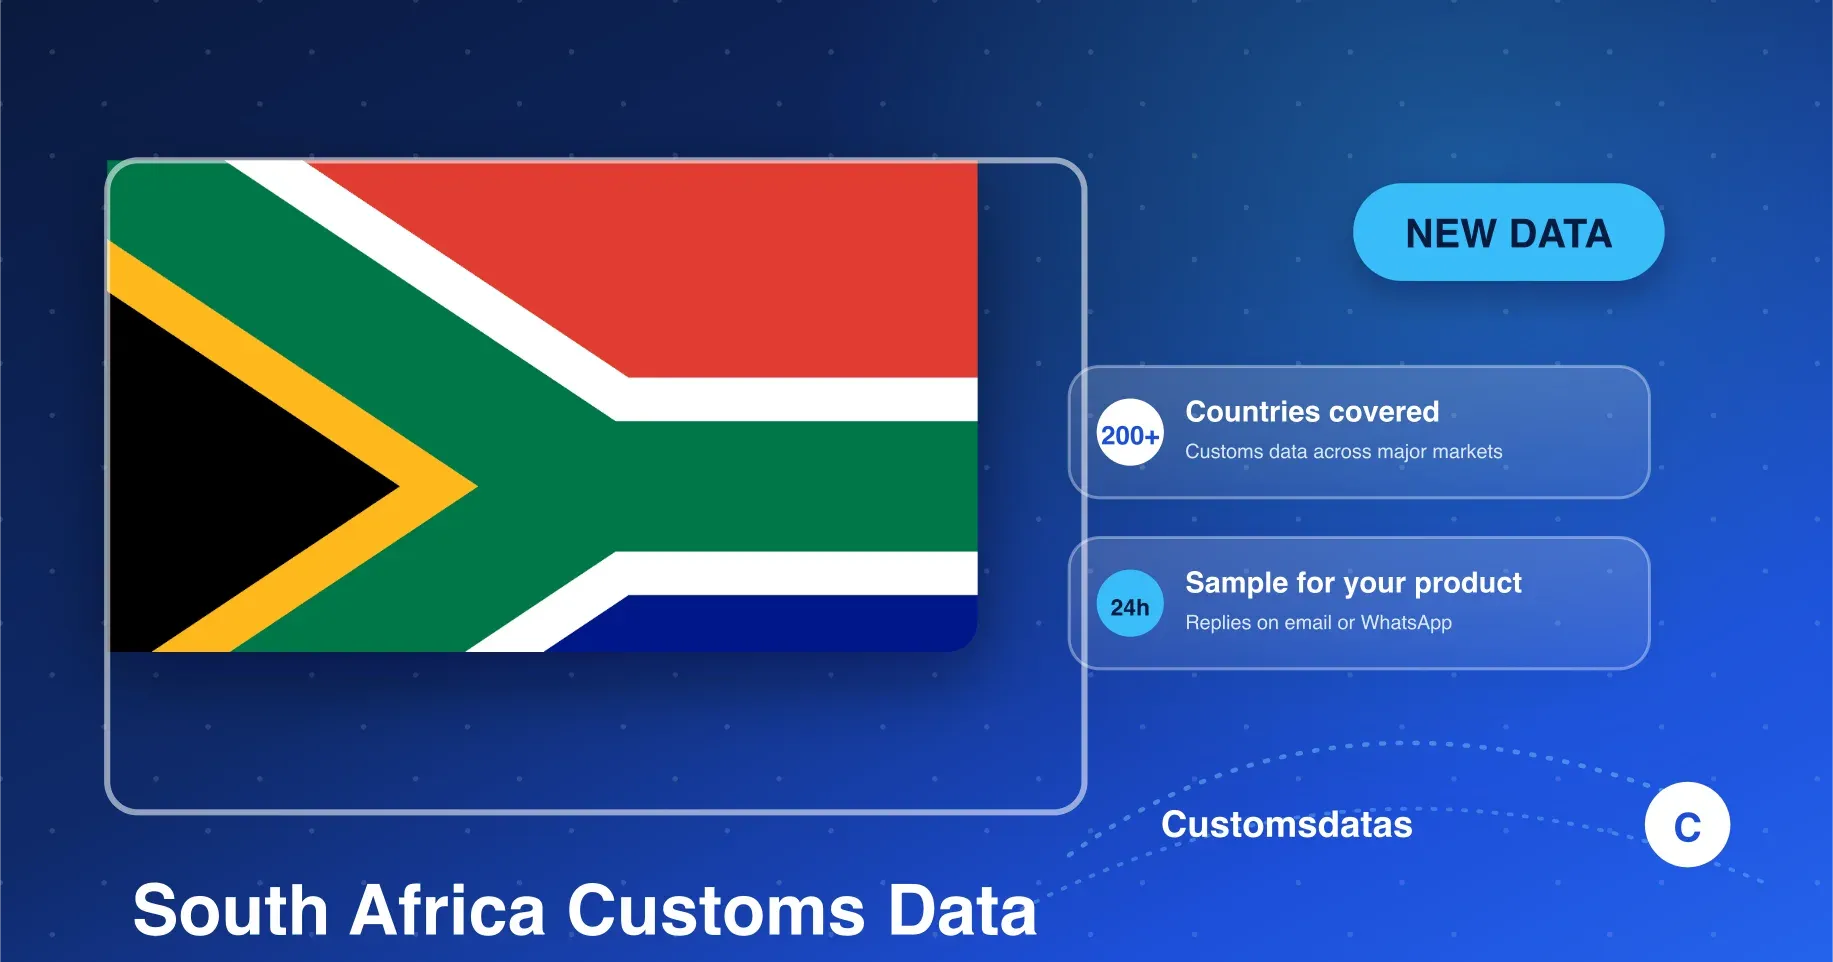
South Africa's coverage on Customsdatas pairs a statistics layer with a trade layer, both under a NEW flag. Each layer answers a different kind of question, and the sequencing between them is what this guide is about. Statistics size a category before you spend a search on it. Declarations then put names and dates on the part worth pursuing.
The pairing matters more here than in most markets because South Africa is commonly described as an industrial economy, one that manufactures a broad range of what it consumes. Imports in a category are not, then, a simple measure of demand — they are a measure of demand that local capacity did not cover. Reading that residual correctly is the whole skill.
Why South Africa gets two layers
Most markets give you one angle on themselves. A statistics layer summarizes flows by category and period, which makes it the right instrument for structural questions: how large a category is, whether it is growing, and how it compares with neighbouring categories. A trade layer shows individual movements, which makes it the right instrument for operational questions: who, how much, how recently.
Using them in the wrong order is the most common waste of time in a two-layer market. Searching declarations before you know which category is worth the effort produces a long list of undifferentiated names; reading statistics without ever descending to declarations produces an elegant market view with nobody to contact.
The statistics layer: structure before names
Start with structure. Pick two or three candidate categories, and read their relative weight rather than their precise values: which one is large enough to carry a campaign, and which is small but moving. This is the point at which you discard without guilt — a category that reads thin in statistics rarely rewards a declaration search.
Buyer tip: note the statistics reading next to the date you read it. When you return in a quarter, the comparison between two dated structural readings tells you more about direction than any single figure can.
Imports as a map of unmet capacity
In an economy that manufactures widely, persistent imports of a finished category are informative precisely because domestic production exists. They mark the segment where local supply does not satisfy the market — a specification, a volume, a price point, or a lead time that buyers were willing to import for.
Read that way, an import record is not just a transaction; it is a statement about a gap. The practical use is to look for categories where imports are steady rather than spiky, because steady imports alongside domestic capacity suggest a structural opening rather than a temporary shortfall.
The declaration layer: timing and texture
Once a category has earned its place, the declaration layer supplies what statistics cannot: named activity with dates attached. Here you read recency, repetition and spread — the three things that distinguish a live market from a large historical total.
Spread deserves particular attention in an industrial market. A category where movement concentrates in a few accounts behaves very differently from one where dozens of buyers each take modest volumes; the first is a market you enter through the incumbents, the second through volume of outreach.
Sequencing a two-layer search in one sitting
The whole method fits into one working session. Read statistics for two or three candidate categories and rank them. Take the top one into the declaration layer and pull a first pass. Write one sentence per category — sized here, moving there, concentrated or spread — and you have a defensible shortlist and a record of why it exists.
Buyer tip: keep the statistics reading and the declaration pass in the same note. When a colleague asks why you chose this category over that one, the answer should be one glance away rather than a reconstruction from memory.
Choosing sectors before companies
In a large industrial market, the temptation is to start with a target account list and work backwards. The two-layer approach inverts that deliberately: sectors first, then the accounts inside the sector that show the pattern you want. The order matters because sector selection is cheap and account research is not.
The same logic applies to the size of your first pass. Two categories read properly will outperform ten categories skimmed, because the declaration layer rewards knowing exactly what you are looking for before you search it.
Agreement and disagreement between layers
Where the layers agree, act. A category that reads substantial in statistics and shows recent, repeated movement in declarations is a market with both mass and life; that combination is as close to a green light as trade data offers.
Where they disagree, note it rather than resolving it. Statistics behind a busy declaration pattern usually means a category in transition; declarations quiet behind a large statistical total usually means history. Both are useful, and both are reasons to re-read rather than to commit.
Setting up on live records
How the South African record set is organised, how the two layers sit inside it, and what a search actually returns, are all confirmed on a sample run against current data — documentation written for another market is not a substitute for that step.
Request the sample before you commit search terms, and read the columns you actually receive. It is a short step, and it keeps everything above grounded in what the file can really answer.
Frequently Asked Questions
Which layer should I open first?
Statistics. Use it to size and rank candidate categories, then take only the winners into the declaration layer where names and dates live.
Do imports mean local industry is failing?
No. Steady imports alongside domestic production usually mark a segment local supply does not cover — a specification, volume, price point or lead time buyers were willing to import for.
How do I read both layers on my own category?
Request a free sample through the inquiry form or WhatsApp. The team replies within 24 hours (Mon-Sat, GMT+8) with South African records matched to your product line.
Want to see both of South Africa's layers before you plan around them? Request a free sample from Customsdatas and open both within 24 hours.