Oct 5, 2026Country Guides
Saudi Arabia Customs Data (2026): Concentration Comes Before Opportunity
In a large market, the size of a category says less than the spread of its participants. How to read concentration — and why concentrated and fragmented categories call for different plans.
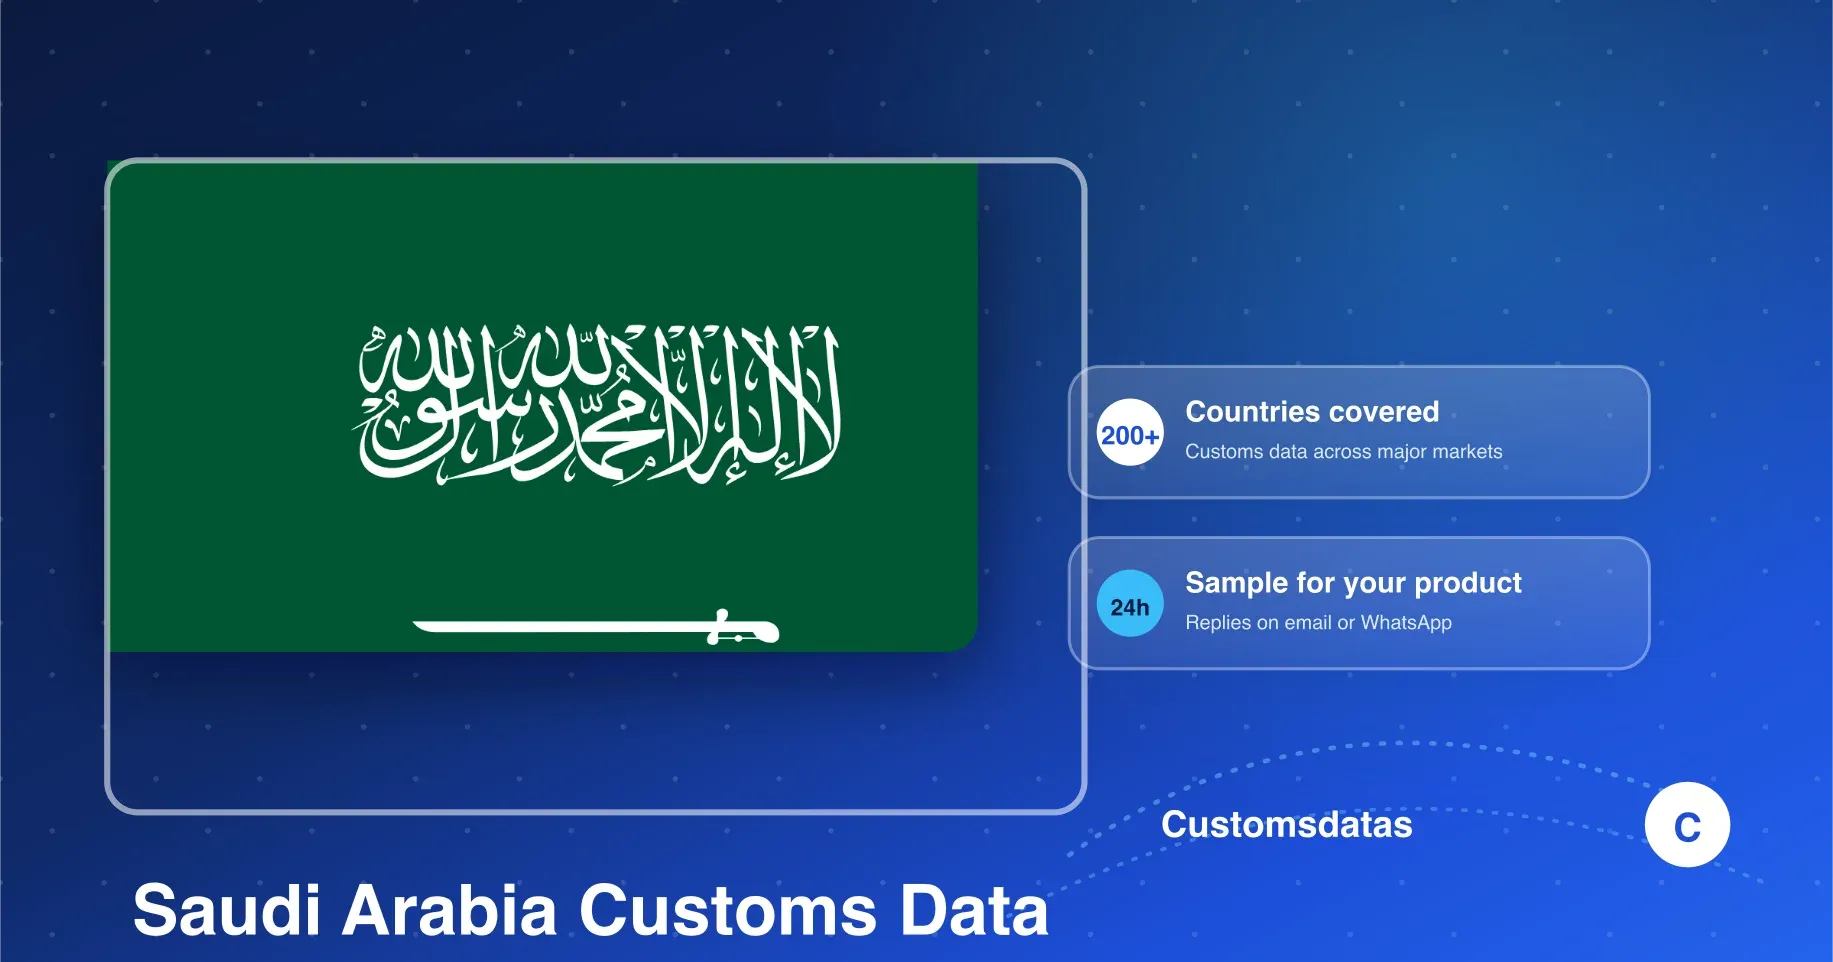
Saudi Arabia carries two documented layers on Customsdatas — shipping and statistics — and the coverage table leaves their field detail unlisted, so the working specifics are settled by a sample run. What the two-layer shape decides up front is the first question to ask of any category: not how large it is, but how participation is spread across it.
In a market this large, size is the easiest number to read and the easiest to misread. A category can carry enormous volume and still be closed to a new supplier if a handful of players move most of it; another can look modest and be genuinely open because dozens of businesses share it. Concentration is the variable that decides which of the two you are looking at — and it takes one extra reading to see.
Big market, uneven opportunity
Volume answers how much moves; participation answers who moves it. The two are independent, and the second one is what a supplier actually needs. A category's participant count and its distribution across those participants are the readings to take first, before any outreach math starts.
Buyer tip: put the participant count beside each category before you rank anything by size. Two categories of equal volume with very different counts are two different markets, and they will not respond to the same approach.
Reading the participant spread
The spread is a distribution, not a list: how many parties move the category, and how evenly movement is divided among them. The reading pass is deliberately simple — count the parties, then notice how lopsided the distribution looks. Most categories resolve quickly into one of two shapes, and the two shapes call for opposite plans.
One first-session pattern worth noting: concentration is measured per category, not per market. The same economy can hold a category owned by three players next to one shared by sixty, and a campaign that treats the country as a single concentration level will mis-size both. Repeat the count for each candidate category, and carry the shape notes side by side.
When participation is narrow
A concentrated category is not a closed one, but it is a specific kind of one. The large players usually buy on scale terms a new supplier cannot match, and the practical openings sit one tier down: mid-sized importers that live in the shadow of the leaders and need exactly the flexibility a smaller supplier offers. The plan is narrow and targeted — a handful of accounts, approached with specificity.
The many-holder case
A fragmented category rewards the opposite strategy. With movement spread across many parties, no single account carries the campaign, and the work becomes breadth: build a longer list, qualify in batches, and let volume of conversations do what depth does in a concentrated market. Recognising which shape you are in decides the shape of the whole effort.
Which layer answers which question
The two documented layers split the work naturally. The statistics layer carries structure — how categories sit against each other at the aggregate level, which is the fastest instrument for a first concentration read. The shipping layer carries action — movement records that tell you which parties are actually moving goods, and how regularly. Structure first, then movement: one pass each, in that order.
A one-page map and its handoff
A concentration map is a one-page instrument: chosen categories, participant counts, concentration shape, and a note on which strategy each shape implies. It is small on purpose — this is a deciding document, not a research archive — and every entry points back to the layer that produced it.
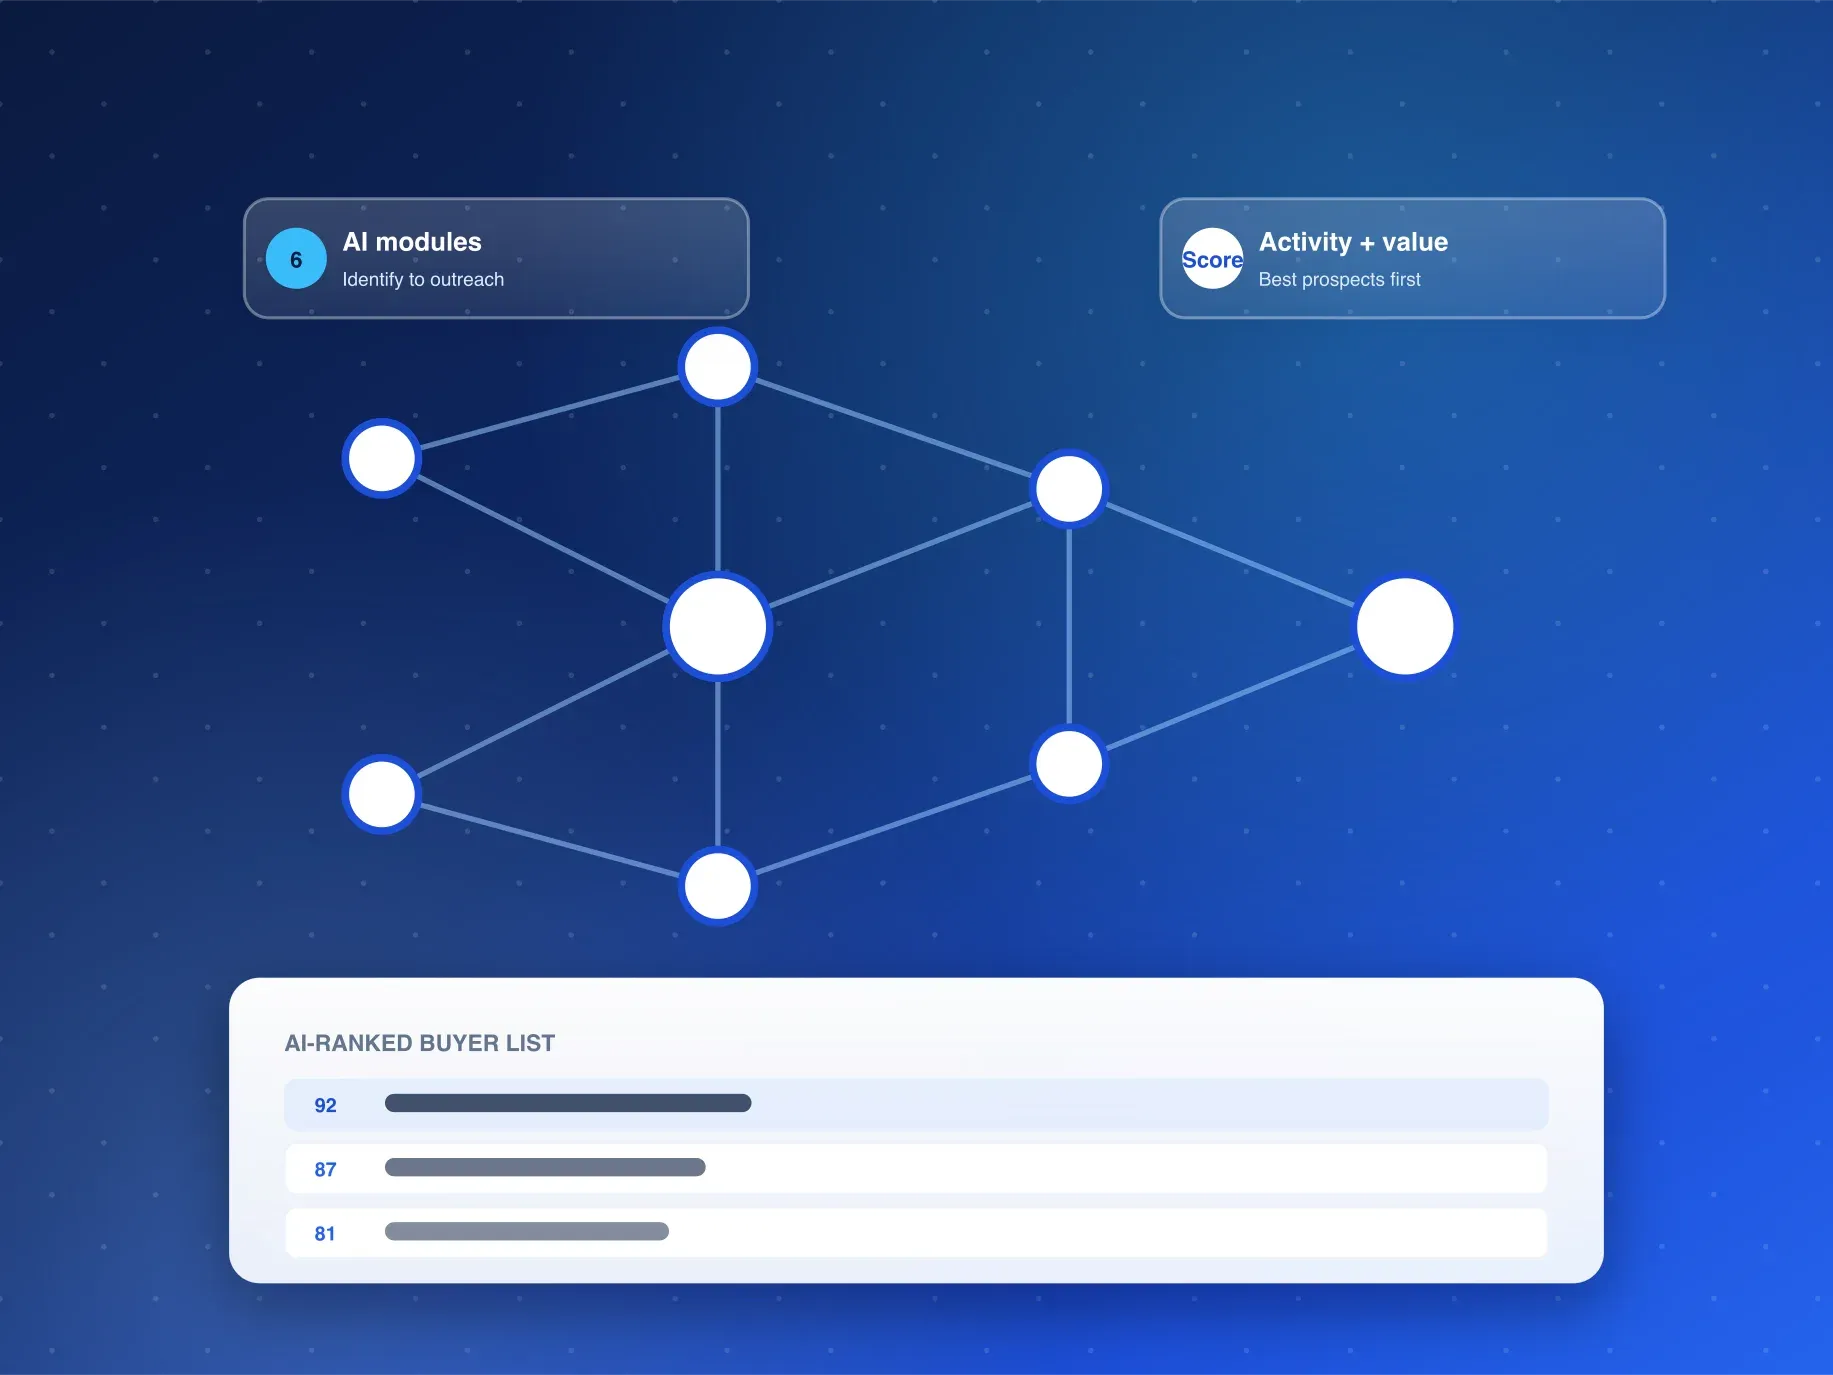
The shortlist from the map then goes into the AI Buyer Discovery Suite for its six modules: identification, activity and opportunity value, market recommendation, similar-buyer discovery, outreach lists with emails and WhatsApp contacts, and competitor buyer detection. From there, the concentration shape you recorded decides which half of that list gets approached first.
Ranking inside a shape also deserves one note. In a concentrated category, the shortlist will be shorter than feels comfortable — a handful of mid-tier accounts. Resist padding it: the concentration that created the narrow window also means extra names would be noise. In a fragmented category the pressure runs the other way, and the risk is stopping the list too early rather than over-building it.
Keep the map and the movement layer in one file with two sections rather than two files. The map without movement is a thesis; movement without the map is a pile of names. Filed together, each section answers the other's first question — who is this, and why should they appear here.
A sample pass over both layers
Because the coverage table leaves field detail unlisted for this market, one sample run settles the working basics: how each layer's records are arranged, what a query returns from them, and how current the window runs. Rehearse the reading order on that sample, so the first real session is a repetition rather than an experiment.
Frequently Asked Questions
What layers does Saudi Arabia's coverage include?
Two layers, shipping and statistics, both listed in the coverage table. Their field detail is not broken out there, so a sample run is what settles it.
Why does concentration matter more than size?
Because size says how much moves while concentration says who moves it — and the second decides whether a new supplier can realistically enter, and how.
How do I start a concentration read?
Name the product line you want read on the inquiry form or WhatsApp, and the team sends your Saudi sample within 24 hours (Mon-Sat, GMT+8).
Curious whether your category is held by a few or shared by many? Request a free sample from Customsdatas — the spread read follows inside 24 hours.