Oct 7, 2026Country Guides
Qatar Customs Data (2026): Read the Deviations, Not the Averages
Two documented layers — shipping and statistics — describe the same commerce at two grains. Read one as the expectation and the other as the observation, and work the gaps.
Qatar shows up on Customsdatas carrying two documented layers, shipping and statistics, and the coverage table stops there — what each layer's records hold is settled by a sample run against current data. Two layers at two grains invite a comparison, and this guide is built around one specific way to run it: treat the statistics layer as the expectation and the shipping layer as the observation, then spend the session on the rows where the two disagree.
Most rows will agree, and that is fine — agreement is the baseline that makes the rest readable. The productive part of the read is the remainder: categories whose aggregate weight suggests activity the movement records do not show, and movements that show up individually without much aggregate weight behind them. Deviations in either direction are where a market is changing faster than its averages admit.
Expectation and observation, defined
The expectation layer answers what a category looks like in aggregate: its weight, its period shape, its standing against neighbours. The observation layer answers what actually moved, at whatever grain a sample run shows the entries to carry. Reading one against the other converts two parallel descriptions into a single question — where does the picture at ground level fail to match the picture from above?
Buyer tip: fix the window before comparing. An expectation drawn from one period against observations from another produces gaps that are calendar artifacts, not findings.
Two kinds of gap, two next moves
Deviations come in two kinds and they point at different opportunities. Where the aggregate is substantial but individual movements are thin, the category may be dominated by arrangements the movement layer records sparsely — a question worth asking rather than a verdict worth announcing. Where movements are visible but the aggregate is modest, something specific and current is happening below the summary level — often the earliest readable stage of a shift.
Neither kind is good or bad on its own. What makes them useful is that each names a next action: the first kind earns a re-check on a later pull, the second earns a closer look at the parties involved.
A short worked example fixes the idea. Suppose the aggregate shows a category carrying steady weight across the window, but the movement entries for it are few and scattered — the gap says the summary and the street disagree, and either the movement layer records that trade sparsely or the trade concentrates in arrangements worth identifying. The gap itself does not decide which; it only earns the category a place on the agenda, which is all a first read should promise.
The reverse case works symmetrically. Movements visible at street level with little aggregate weight behind them tend to be either new, seasonal, or parked in a neighbouring category — three explanations with three different next steps, and the gap row is what put the question on the desk before any of them could be guessed.
Working the gap rows
The working session is short once the frames are set. Align the two layers on the same categories and window, mark the rows that agree, and pull the disagreeing rows into a separate list. That list is the agenda: a handful of categories, each with a direction (quiet above, moving below; or busy above, quiet below) and a date. A gap list with dates is a working document; one without is trivia.
Buyer tip: cap the gap list at five categories. The point of the method is focus — five well-tracked deviations beat thirty curiosities, and the cap forces the comparison to be honest about which gaps actually matter.
A wobbly yardstick makes noisy gaps
Deviations are only as good as the expectation underneath them, so the baseline needs its own check. Read the statistics layer for stability across periods before trusting it as the yardstick: a category whose aggregate swings widely period to period will produce gap rows that are noise rather than signal. Stable baselines make honest gaps.
Before acting on a gap
A deviation is a reason to look closer, never a reason to write a letter by itself. The closer look is the sample run for the record grammar — what the movement entries actually carry, how parties appear, how current the window runs — because a gap can also be an artifact of how one layer records what the other summarizes. The sample settles which gaps are real questions.
Turning gap rows into next checks
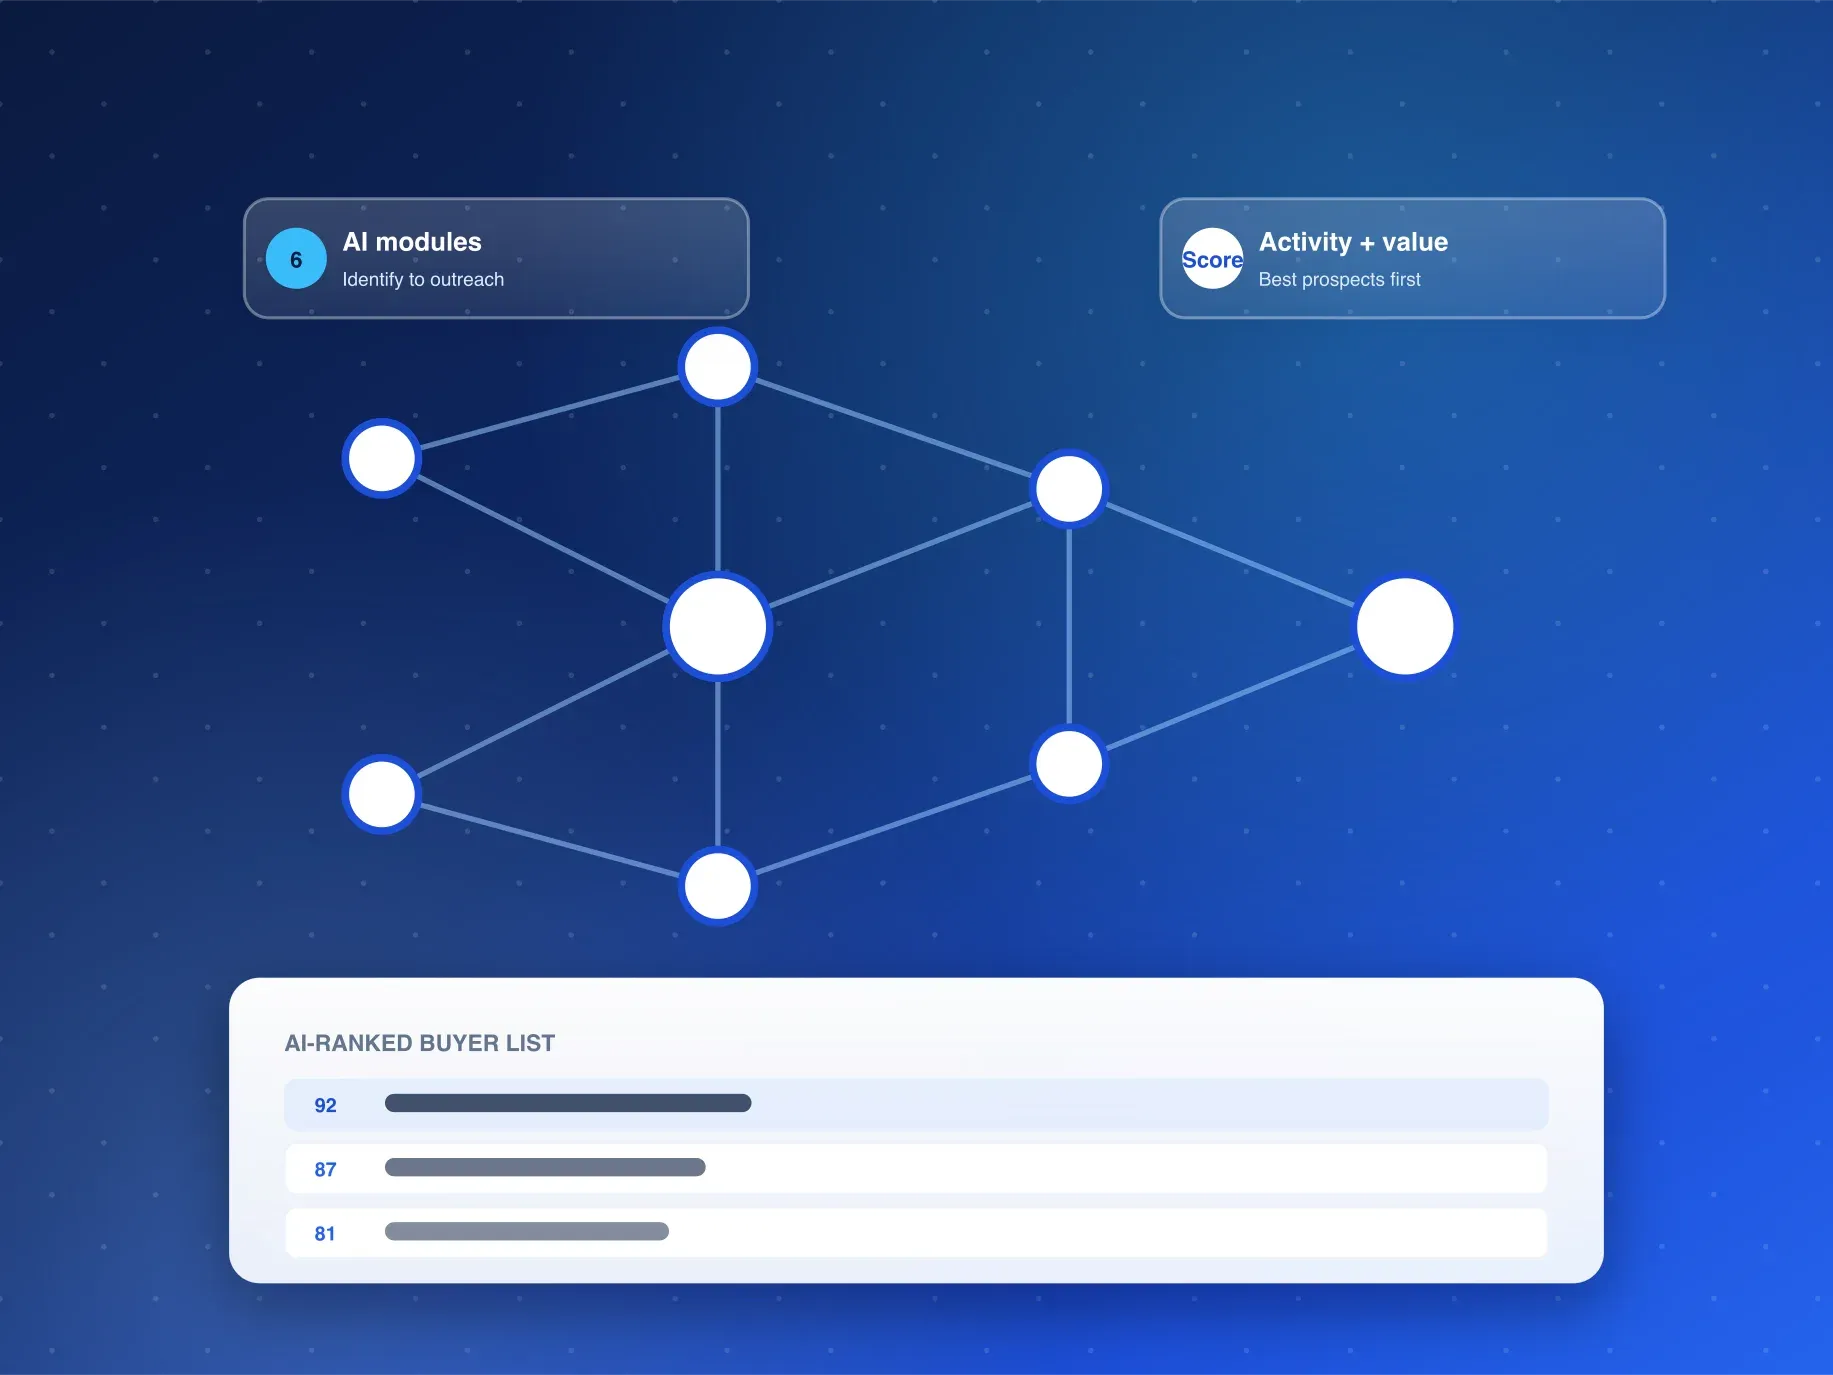
The output is deliberately small: the agreed baseline, the capped gap list, and a note per gap on which direction it ran and what the next check is. From the capped list, the AI Buyer Discovery Suite picks up the scoring and contact pass — identification, activity and opportunity value, market recommendation, similar-buyer discovery, outreach lists with emails and WhatsApp contacts, and competitor buyer detection — on the parties the gap rows surfaced, so the outreach list inherits the method's focus instead of diluting it.
A gap that survives the sample check becomes a tracked item rather than a one-time observation. Give it a line in the working file — category, direction, date first seen — and re-read it on the next pull. Tracked gaps either widen, which confirms the shift, or close, which retires the question; both outcomes update the picture, and neither requires more effort than a tick.
The method also ages well. Because expectations come from the aggregate layer, they refresh on their own cadence, and the gap list is rebuilt against a moving baseline rather than a frozen one — the comparison stays current without the reader maintaining a private model of the market.
Frequently Asked Questions
What layers does Qatar's coverage include?
Shipping and statistics, as documented. What the records in each layer carry is not itemized in the coverage table; the sample run against current data answers that.
Why read deviations instead of the totals?
Because totals describe where a market has been, while the gaps between aggregate and observation mark where it is changing — and change is where a new conversation is possible.
How do I start a gap read on Qatar?
Ask through the inquiry form or WhatsApp — Qatar records matched to your product line are in the reply, which reaches you inside 24 hours (Mon-Sat, GMT+8).
Want to know where the two views of your category part ways? Request a free sample from Customsdatas — the gap list can be started inside 24 hours.