Sep 30, 2026Country Guides
Philippines Customs Data (2026): Distribution Before Depth in an Island Market
Demand in an archipelago is split across landing points, not concentrated in one. How to read distribution first — and why that order changes who you approach.
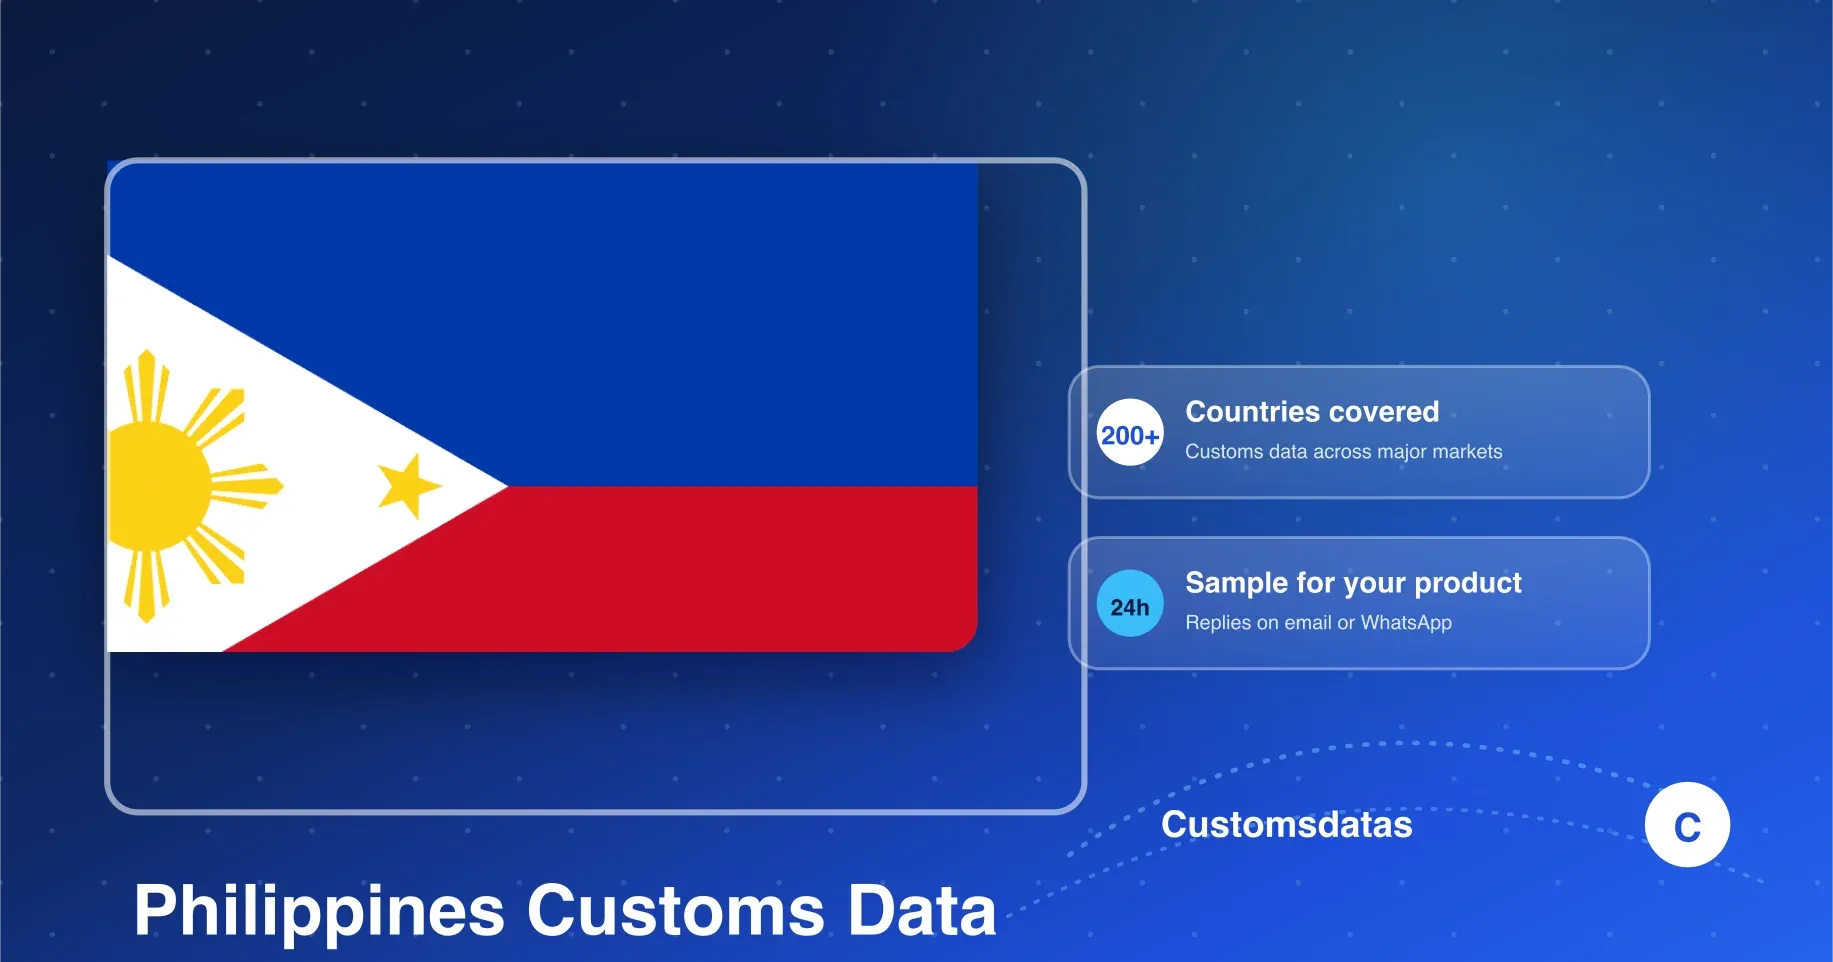
The Philippines arrives on Customsdatas with trade, shipping and statistics layers. The configuration is broad; the market it describes is archipelago-shaped, and that shape decides how the file should be read.
Island markets break the habit of reading a country as a single demand pool. Goods arrive at several landing points and move along different internal routes to different populations. Reading a national total first answers a question few suppliers actually have; reading distribution first answers the one that decides the campaign.
Why distribution comes before size
In a contiguous market, a category total is a fair proxy for the opportunity: demand concentrates toward the interior and the number reflects it. In an archipelago, the same total can hide two very different realities — one landing point carrying most of the flow, or demand split across several. Same number, different strategy.
Buyer tip: before ranking categories by scale, read where each category lands. The distribution pattern is stable enough to plan around, while the totals alone will keep tempting you toward markets with no clear entry point.
Landing points and their hinterlands
Each landing point serves a hinterland — the population and businesses reachable from it. Read the two together: a landing point with heavy flow and a rich hinterland is a market entry point; one with heavy flow and a thin hinterland is often transshipment rather than local demand.
This reading turns the archipelago from an obstacle into a map. Instead of asking how big the Philippine market is, you ask which hinterland your product serves and which landing point feeds it. The second question has a short, practical answer.
Scale read without a single market
Scales behave differently across an archipelago. A category that looks mid-sized nationally can be dominant in one hinterland and absent elsewhere — and a regional position is often easier to defend than a national one. Read size at the level where your product would actually compete.
Buyer tip: keep one sheet per landing point rather than one sheet for the country. The comparison between sheets is the real market research; a merged national sheet averages away the structure you are trying to see.
Where redistributors fit
When demand is dispersed, the businesses that move goods between landing points and hinterlands occupy the middle of the trade. They are frequently the practical first contact for a new supplier, because one relationship reaches a hinterland that would otherwise need many separate ones.
Identifying them is a reading exercise, not a label lookup: parties visible across more than one landing point, or across both directions, are the ones whose reach exceeds a single location. Confirm the pattern before assuming the role — the first conversation settles what the file can only suggest.
There is a cheaper check as well: a party whose movements span several hinterlands usually shows a rhythm of smaller, repeated consignments rather than one large delivery, because redistributors restock against many downstream customers rather than against a single installation. Look for the rhythm, then verify the role.
The speed dimension in island trade
Speed matters more in island geographies than a volume measure would suggest: for high-value or time-sensitive categories, delivery pace decides which suppliers can be considered at all. Whether a faster channel appears in the Philippine file, and what it carries, is settled by a live sample run, not by the coverage description.
When your sample shows more than one channel in play, read them as separate rosters before merging. A party that leads on pace can be invisible in the volume picture, and a strategy that only follows the largest channel will miss precisely the segment willing to pay for speed.
There is also a timing dimension to plan for: faster channels react to demand sooner than slow ones, so where a category moves through more than one channel, the quicker roster is often where a change becomes visible first. Treat it as the leading indicator and the volume view as the confirmation — two different jobs for the same market.
Grounding the read in actual records
How the layers for this market are actually organized, and what a search against them returns, is something only a live sample run can settle; a coverage description written for a general audience is not a substitute. The distribution method needs the file's real shape to sit on.
Treat that step as calibration, not research: read the sample the way you intend to read the market, then write your search terms around what the records can genuinely answer.
From a distribution map to a shortlist
The output is a map: categories by landing point, hinterlands noted, redistributors marked and double-checked. That map reduces the campaign to a sequence of local decisions — which hinterland first, which channel, which middle party — instead of one large national bet.
The scoring and contact pass for that map then goes through the AI Buyer Discovery Suite — identification, activity and opportunity value, market recommendation, similar-buyer discovery, outreach lists with emails and WhatsApp contacts, and competitor buyer detection. It ranks the list you built; the archipelago logic is what made that list worth ranking.
Frequently Asked Questions
What layers does the Philippines coverage include?
Trade, shipping and statistics layers. What each layer returns for your category, and how current its window is, are settled on a sample run.
Why not start from the national totals?
Because one national number can describe either a concentrated landing pattern or a dispersed one — and those call for different campaigns. Reading distribution first costs little and keeps the total honest.
How do I see the distribution on my category?
Write to the team via the inquiry form or WhatsApp with your product line, and the Philippines sample follows within 24 hours (Mon-Sat, GMT+8).
Want to see where your category actually lands before you plan a campaign? Request a free sample from Customsdatas and begin the landing map within 24 hours.