Oct 1, 2026Country Guides
Pakistan Customs Data (2026): Rebuilding an Account Timeline From Two Layers
With trade and shipping layers and no ready-made profile, the account story is something you assemble: two layers, one timeline, and three patterns worth naming.
Pakistan's coverage on Customsdatas holds two layers — trade and shipping — and no ready-made account profiles. That absence defines the method. Instead of looking up a profile, you build one: pull an account's movements from both layers, lay them on a single timeline, and read the story the sequence tells.
A timeline is not a list. A list says what an account did; a timeline says in what order, with what gaps, and at what pace — and those three properties are what distinguish a growing relationship from a stalled one, something no unordered total can show.
A total is not a story
Two accounts can share the same total volume over the same window and be entirely different customers: one moving steadily every month, the other loading everything into a single burst. The total calls them equal; the timeline shows one as a standing supply need and the other as a project that may already be over. When you only have two layers to work from, extracting the timeline is how you recover that difference.
Buyer tip: build the timeline before reading anything into an account. Impressions collected from totals survive review worse than readings taken from sequences — the sequence is the evidence, the total is the summary.
The merge that makes one line
Each layer contributes events of a different kind, and the merge step is where the work happens. Sort everything an account shows by date, keep the layer of origin beside each event, and resist averaging: the goal is one ordered line, not one blended number.
Where the two layers speak about the same movement, note the pairing; where the record shows an event in only one layer, keep it visible and single-sourced. A timeline with visible provenance is what makes the next step — verification — cheap.
Three patterns worth naming
Almost every timeline resolves into one of three shapes. Continuous: events at a stable pace across the window — a working supply relationship. Accelerating: spacing between events shrinking, or volumes rising against a steady count — a business expanding its purchasing. Dormant: a strong sequence that simply stops — the most ambiguous of the three, and the one that most deserves a question rather than a conclusion.
Name the shape for each account on your list. The three names compress a lot of evidence into one word, and they make the list sortable by something more useful than size: readiness. A shelf of named shapes also keeps later conversations honest — when a colleague disputes a priority, the shape and its timeline are right there to inspect.
The shapes are also a fair way to spend your week. Dormant accounts return the most information per letter, accelerating accounts return the most business per letter, and continuous accounts return the most certainty per letter — three different currencies, and picking which one this week can afford is a planning decision, not a reading one.
Reading gaps without overreading them
Gaps are the timeline's most tempting feature and its most misread one. A pause can mean a finished relationship, a seasonal cycle, a switch to a competitor, or simply that the account's next movement has not entered the file yet. The honest treatment is to record the gap, check whether the same interval repeats elsewhere in the account's history, and let a repeating interval suggest seasonality rather than exit.
Buyer tip: an account that stops is a question, not a verdict. Write the question into your notes — the first reply is usually the cheapest way to learn the answer.
Timelines as outreach briefs
A finished timeline almost writes the first letter for you. The shape (continuous, accelerating, dormant) sets the tone; the recent touch points set the opening line; the layer of origin sets which facts you can cite with confidence. Outreach built this way reads informed without reciting the file — because it is built from the account's own sequence, told back in order.
Consistency across the list
One timeline is an anecdote; a shelf of them is a method. Build every account the same way — same layers, same window, same sorting rule — so the shapes you name are comparable across the list. The consistency is also an audit: anyone who doubts a call can rebuild the same timeline and reach the same shape.
Before the first session, confirm how the two layers actually behave for this market — what each search returns and how records are shaped — on a sample run against current data. The timeline method is only as good as the events feeding it.
Start the sample where your curiosity is strongest. Reading a sample of a category you understand is how the timeline format gets calibrated — you will spot immediately whether an event pairing looks right, which trains the eye you will use on categories you understand less well.
Scored accounts from named shapes
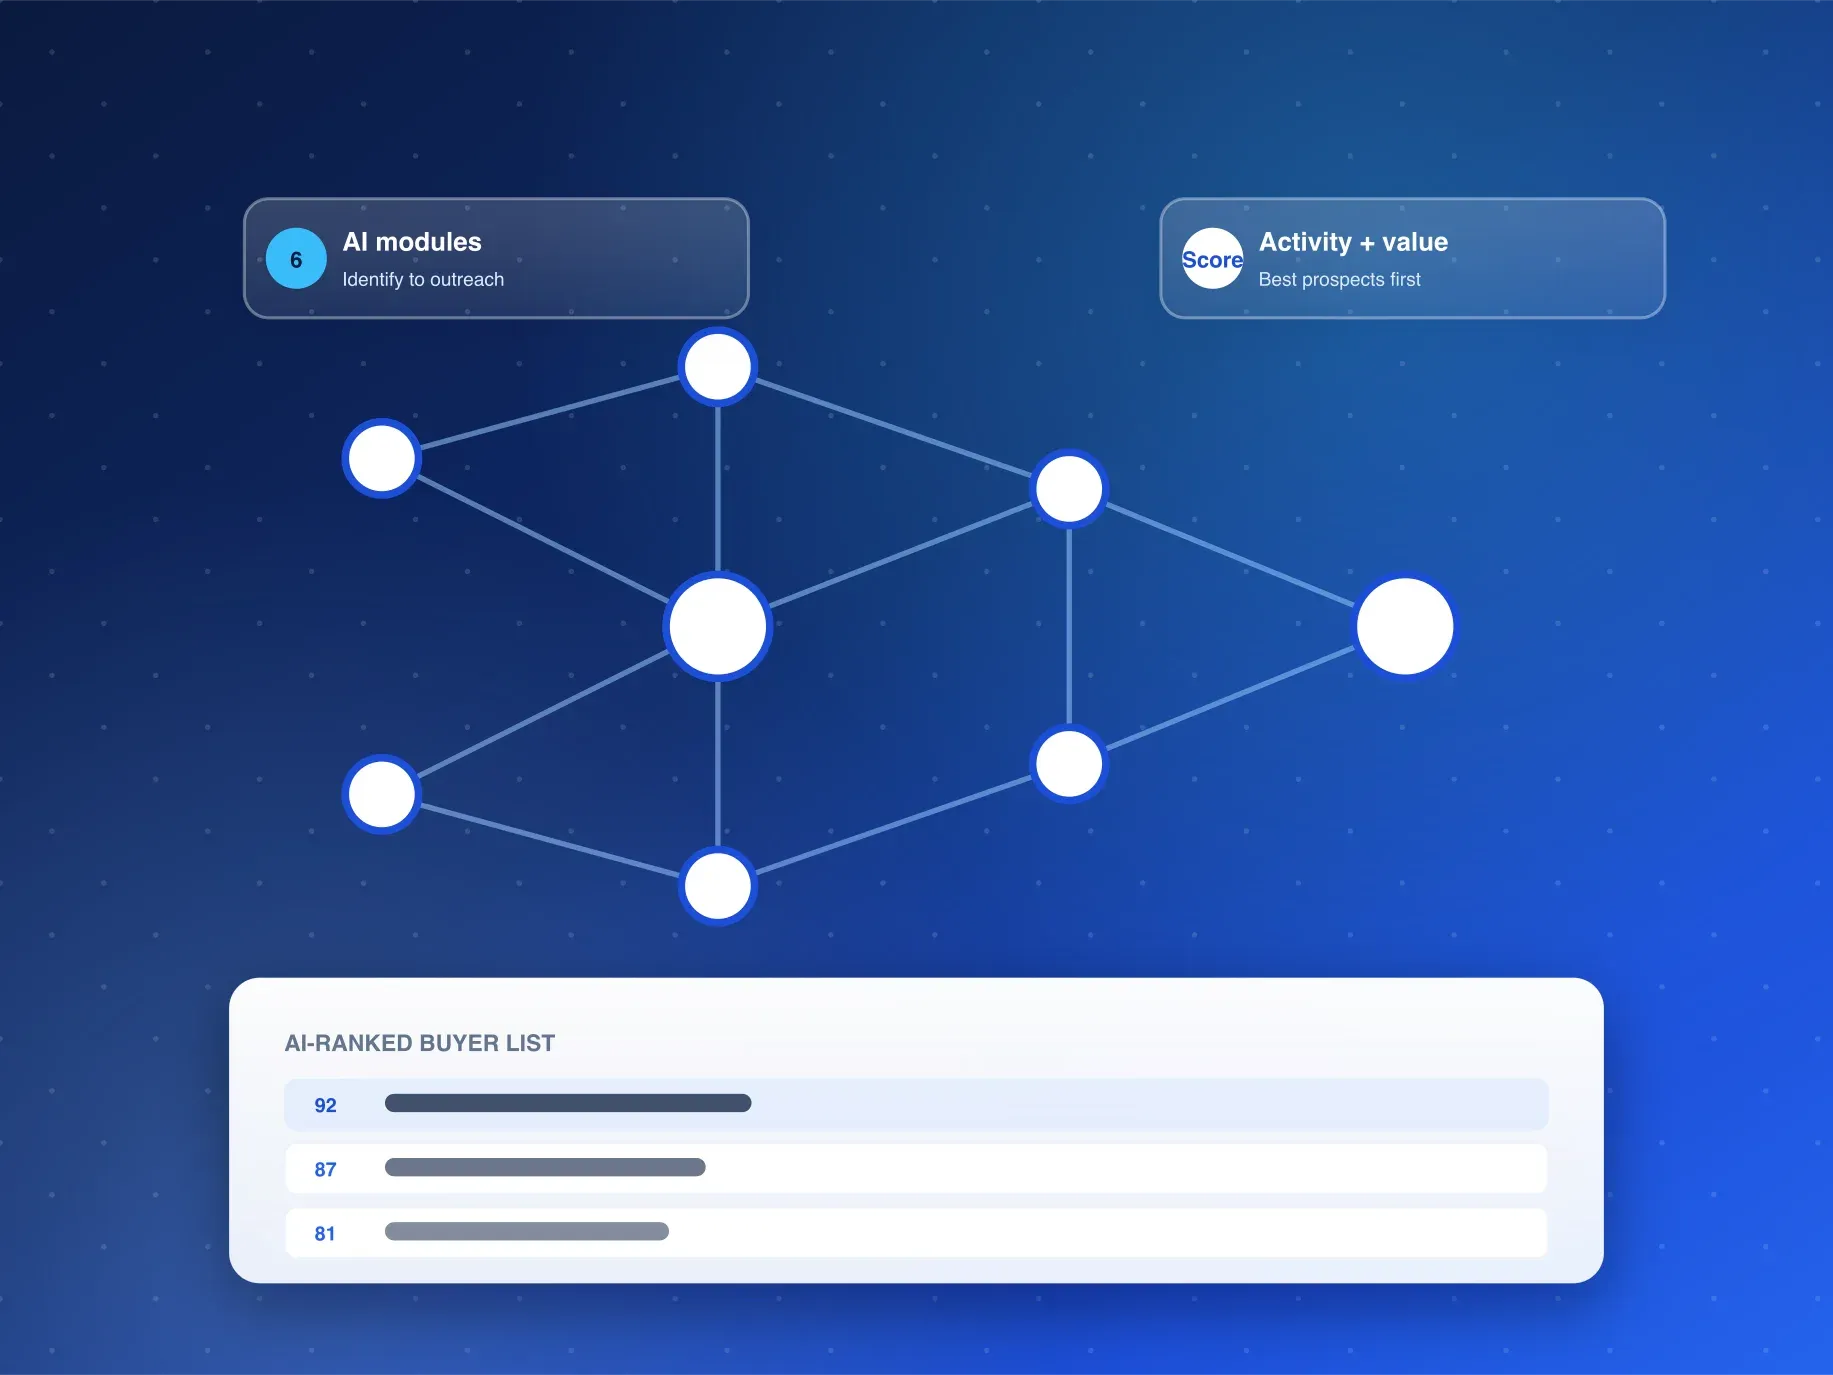
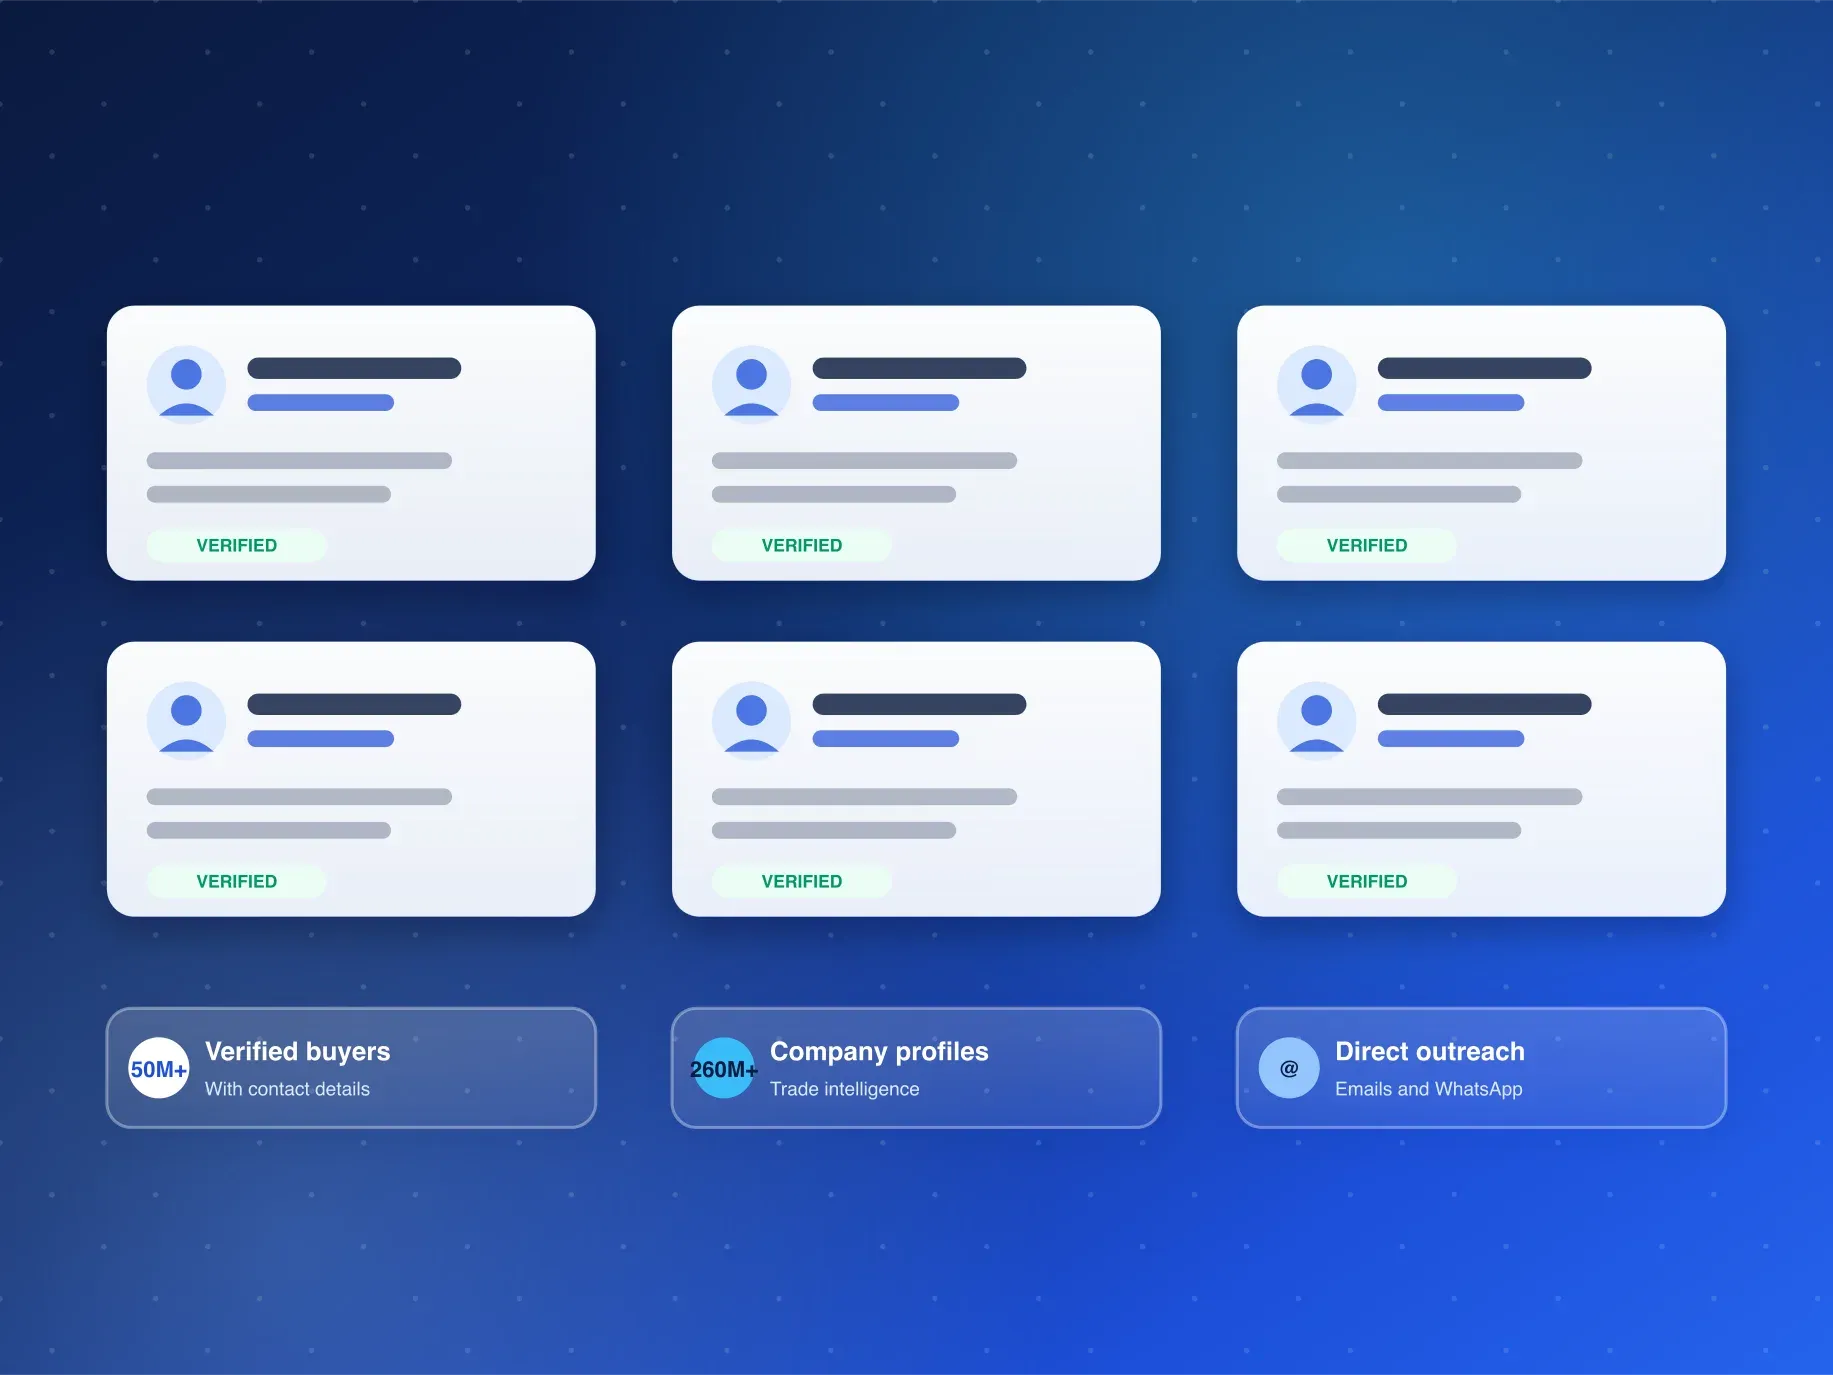
The output is a set of account timelines with named shapes and noted gaps — a compact, rebuildable picture of the market's current relationships. It is also the cleanest possible input to the next step: the AI Buyer Discovery Suite moves on to the scoring and contact pass — identification, activity and opportunity value, market recommendation, similar-buyer discovery, outreach lists with emails and WhatsApp contacts, and competitor buyer detection — over accounts whose stories are already in order.
Frequently Asked Questions
What layers does Pakistan's coverage include?
Trade and shipping layers. How each layer is organized, and how current the window runs, is confirmed on a sample run rather than assumed.
Why rebuild timelines instead of reading totals?
Because totals hide sequence, and sequence is where relationships become visible. Two accounts with identical totals can be a steady customer and a finished project — the timeline is what tells them apart.
How do I start building timelines on Pakistan?
Name your product line on the inquiry form or WhatsApp; a Pakistan sample goes out within 24 hours (Mon-Sat, GMT+8).
Want your first three account timelines in order? Request a free sample from Customsdatas and rebuild them from the records within 24 hours.