Sep 30, 2026Country Guides
Bangladesh Customs Data (2026): Being Your Own Statistics Office
With trade and shipping layers but no statistics layer, the records themselves are the aggregate. How to count a market honestly — before the counting counts you.
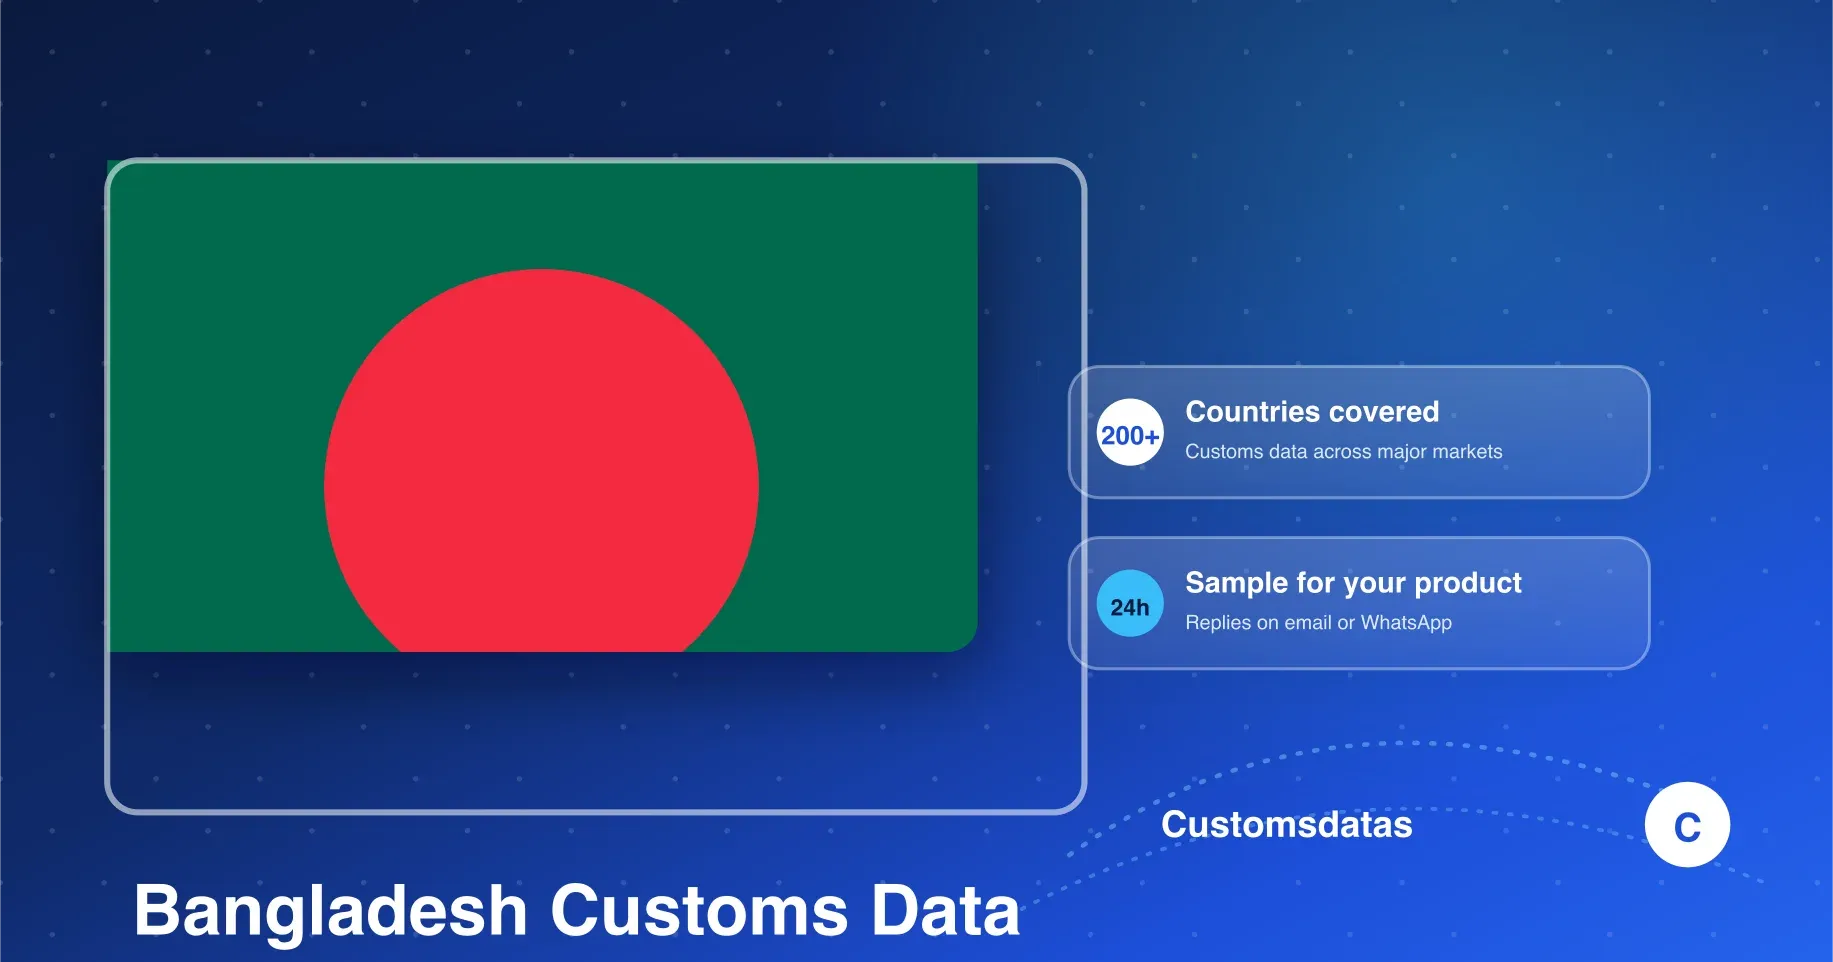
Bangladesh appears on Customsdatas with two layers — trade and shipping — and no statistics layer. Most markets offer a macro view to lean on; this one does not, which changes the first job of the reader. Where a statistics layer would have summarized, you aggregate. Where a prepared table would have ranked categories, you count.
Being your own statistics office is not a downgrade. A self-built aggregate keeps its method visible — you know exactly which records produced it and which window they came from — while an inherited summary often answers a slightly different question than the one you asked.
No statistics layer, no shortcut
The missing layer costs you one convenience: a quick ranking of categories before you search. Without it, the entrance to the market is your own category knowledge — the products you can name and the codes you can list — and the discipline is to search them methodically rather than to browse a prepared table.
Buyer tip: write your candidate categories down before the first search and give each one the same window. A self-built aggregate is only as honest as the equality of treatment behind it.
The records are the statistics
With a trade layer present, the raw material for aggregation is there: movements that can be counted by category, by period, and by how many distinct accounts each category involves. Counting is not a poor substitute for statistics; done deliberately, it is more specific, down to names.
What you lose is the pre-aggregated view over categories you did not think to search. What you keep is the ability to aggregate at any granularity you choose, including ones no standard table offers — a specific code, a specific window, a specific list of accounts.
Counting categories from movement
Rank candidate categories by two counts rather than one: total movements and distinct parties. A category with many movements from few parties is a concentrated market — approach the incumbents properly or not at all. A category with fewer movements spread across many parties is a broad market where outreach works better than heroics.
Buyer tip: report both counts together or neither. A one-number ranking of a self-built aggregate hides exactly the structure that decides how you enter.
Reading the trade and shipping windows together
The two available layers describe related but different things, and at the category level they should be read as a pair. Trade records give the commercial picture; shipping records give the physical movement behind it. Where both layers show the category, the read is grounded; where only one shows activity, note it as a question rather than forcing an answer.
The practical value of pairing them appears when you shortlist accounts: a party visible in both layers is a more complete picture of a working trade than a party visible in one, and it is worth the extra verification step before a first letter.
When the two layers disagree at the category level, resist choosing a winner. A trade layer busy while shipping reads quiet may mean the goods moved in ways the shipping layer records differently, or it may mean the window differs between layers. Either way the correct next move is the same: note the discrepancy, keep it visible in the sheet, and settle it before it reaches a recommendation.
What a sourcing economy asks of a reader
Some markets are predominantly sources of supply; others are mainly consumers. Bangladesh's export industries are its well-known calling card, but a supplier-oriented reader should not let that reputation decide the question: for your own category, the records decide whether the flow is inbound, outbound or both — and that reading comes from your own counts, not from the country's image.
What self-built counts return
Self-built aggregation pays twice. First, in the answer: you can size and rank categories that prepared tables would have merged together. Second, in the audit trail: every number you present traces back to specific records you can name, which is exactly what a colleague — or a client — asks for when a recommendation needs defending.
The habit also transfers. Once you have built one aggregate deliberately, every later market read gets faster, because you know which questions need the counting and which can lean on whatever summary the market provides.
A worked example of the discipline: take one code, count its movements over a fixed window, count the distinct parties behind them, and write the two numbers beside the window's dates. That trio — code, two counts, dates — is a complete, reproducible sentence about a market, and ten such sentences will outrank any borrowed table you cannot audit.
From counts to candidates
The output of a deliberate count is modest and useful: categories ranked by movements and parties, the pair of layers noted for each, and a short list of accounts worth approaching. No layer was fabricated and no number outruns its window.
The AI Buyer Discovery Suite takes that output through the scoring and contact pass — identification, activity and opportunity value, market recommendation, similar-buyer discovery, outreach lists with emails and WhatsApp contacts, and competitor buyer detection. It extends a counted list; the counting is what keeps the extension from drifting into invention.
Frequently Asked Questions
What does Bangladesh's coverage include?
Trade and shipping layers, with no statistics layer. The shape of each layer, and the currency of its window, are settled on a live sample rather than assumed.
Is the absence of a statistics layer a problem?
It is a change of method, not a missing capability. You aggregate the records yourself — gaining specificity and an audit trail, at the cost of doing the counting deliberately.
How do I run my own count on Bangladesh?
Through the inquiry form or WhatsApp, describe the product line you want counted, and a Bangladesh sample arrives inside 24 hours (Mon-Sat, GMT+8).
Want to build your own category count from the records? Ask for a free sample from Customsdatas and start counting within 24 hours.